RLAI Reinforcement Learning and Artificial Intelligence (RLAI)
Quickgraph (2D and 3D graphing)

The ambition of this page is to very briefly describe the Quickgraph graphing routines and its various implementations such that readers can quickly determine whether or not it is likely to meet their needs.  External documentation is not here but is pointed to from here.

The quickgraph routines allow users to quickly and easily build 2-dimensional graphs based on lists of numbers. The graphs can have multiple lines (which will be different colors for differentiation), have gridlines, and have detailed axis tickmarks. Histograms are also supported. Once a graph is drawn, the user can easily highlight separate data lines.

Users can also easily make a 3-dimensional graph surface from a 2-dimensional array of data.

The quickgraph routines are based on the graphics package G.

Quickgraph is currently available only for Macintosh Common Lisp and for Python (multiple platforms, based on tk and tkinter).  The former is very stable whereas the latter is under development -- user feedback requested.

Python Installation Instructions for Quickgraph

Requirements:

Installation:

Usage:

     For example:
     python
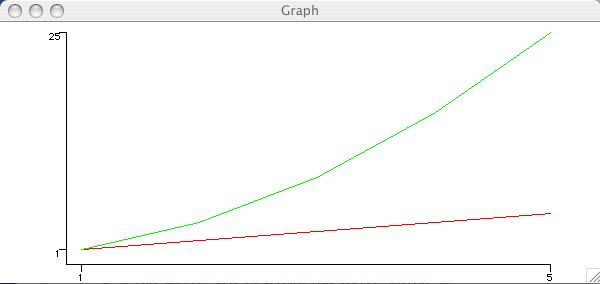
     >>>from Quickgraph.graph import *
     >>>graph([[1, 2, 3, 4, 5], [1, 4, 9, 16, 25]])
     >>>gStartEventLoop()

     You should see a window with two graph lines in it in the upper left hand corner of your screen.
     It may be hidden behind other windows. 


Questions? More information is available here.

Lisp Installation Instructions for Quickgraph

Graph.lisp is built on the G graphics language which is in turn built on Quickdraw. To install G, you need to obtain the file g.lisp (you will also need the quickdraw interface file that came with MCL). To install Graph.lisp you will need to obtain the file graph.lisp. Once you have the files, here is the normal installation procedure (put this in your init.lisp file):
(load "ccl:library;quickdraw.lisp")
(load "g.lisp")
(load "graph.lisp")
(use-package :graph)
Of course if you have compiled these files you will want to leave off the ".lisp" on these files names.
Can i do 3D graphics in Lisp? How is that done? 

Extend this Page   How to edit   Style   Subscribe   Notify   Suggest   Help   This open web page hosted at the University of Alberta.   Terms of use  4512/0