| |
Reinforcement Learning and
Artificial
Intelligence (RLAI) |
| graph.lisp: A graphing tool for MCL |
graph.lisp is a tool to enable users of Macintosh Common Lisp (MCL), to
quickly graph lists of numbers. For example,
if data is a list of numbers, then (graph data)
will pop up a window
with a graph of the numbers, appropriately scaled. Alternatively, the
data can be a list of (x y) coordinates, e.g., ((x1 y1) (x2 y2) ...).
If you
have several lists to be plotted on the same graph, you just
make a list of them and graph that.
(graph '(1 2 3 3 2 1)) ;Graphs the numbers, as heightsThe second example above, for example, produces:
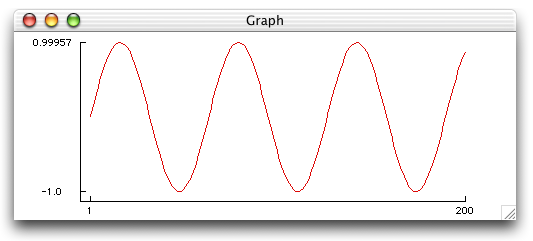
(graph (loop for x from 0 to 20 by .1 collect (sin x))) ;Graphs (sin x); see figure below
(graph (list (list x1 y1) (list x2 y2) (list x3 y3)) ;Graphs line by x,y coordinates
(graph (loop for x from 0 to 3.14 by .01 ;Detailed graph of (sin x)
collect (list x (sin x))))
(graph (list (loop for x from 0 to 20 collect (sin x)) ;Graphs (sin x) and (cos x)
(loop for x from 0 to 20 collect (cos x)))) ;as 2 lines on the same graph
All of the above create a new graph window to hold the graph, or take over the frontmost existing graph window if there is one. If you wish to use multiple graphs, you need to give them names in the forms of strings that are the titles of the graph's windows. The name-strings are an additional argument to graph, as in these examples:
(graph (loop for x below 20 collect (sin x)) "Sine") ; new graph window

(graph (loop for x below 20 collect (cos x)) "Cosine") ; 2nd graph window

(graph (loop for x from 0 to 3.14 by .01
 collect (sin x)) "Sine") ; replace first sin graph
Each line plotted on the graph will normally be a different color, chosen by some default way to be different from the other colors. If you want a line to be a particular color, you indicate this by a second argument to graph, as in:
(graph (loop for x below 20 collect (sin x)) :red) ; red sin lineAllowed values for the color keyword are: :blue, :red, :green, :black, :yellow, :pink, :cyan, :purple, :magenta, :orange, :brown, :light-blue, :gray, :dark-green, :tan, :white, :light-gray, :dark-gray. In addition to keywords, one can also use Macintosh color codes here, such as those produced by the color routines of the G graphics package. When specifying a color, a graph name can still be used, as a third argument, as in
(graph+ (loop for x below 20 collect (cos x)) :blue) ; second blue line on same graph
(graph+ (loop for x below 20 collect (sin x)) :red "My Graph") ; red sin line
You can add a line to an existing graph by using graph+ instead of graph, as in the last two examples.
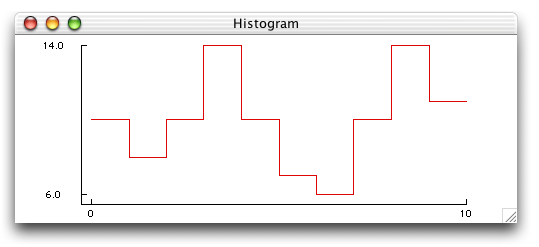
Additional histograms can be added to a graph by calling histogram+. Both routines take keyword arguments:
:color a color to use for the histogram line, as in graphThus, a more complete call to generate the above graph would be (histogram (loop repeat 100 collect (random 10)) :min 0 :max-excl 10 :color :red :graph "Histogram"). Min and max-excl default to include all the data. Num-bins defaults to 30 or, in the case of integer data, to the integer span of the data, if the span is less than 200.
:graph a string indicating which graph to use, as in graph
:num-bins number of bins/intervals to use in the histogram
:min minimum value of data included in the histogram
:max-excl maximum value - only data strictly less than this will be included
Sets the corresponding axis's limits and thus scales the data. If the min or max argument is nil, then it is unchanged. If both are nil, or absent, then the graph returns to automatic scaling. The last argument, graph-title-string, specifies the graph involved, defaulting to the frontmost graph as always.
Of course you can also change the scaling by grabbing the grow box of your graph and changing the size of the window.
For example, (y-tick-marks 0 .5 1) puts y-axis tick marks at zero, one, and a half. You can get even more control by specifying the text labels for the tick marks, e.g., by (y-tick-marks '(0 "0.0") '(.5 "0.5") '(1 "1.0")). If no tick marks are specified, then the axis returns to automated tick-marking (just the min and max).
Plots additional lines, showing data, on the frontmost graph, or the graph indicated by graph-title-string. The graph is rescaled if necessary to accomodate the new data.
Removes a line of data from the frontmost graph, or the graph indicated by graph-title-string. The line removed is given by color-keyword, e.g., :red, etc., as given above.
Removes a line of data from the frontmost graph, or the graph indicated by graph-title-string. The line removed is given by line-number, counting from 0, in the order the lines were added to the graph. If you remove line 0, all the others are of course renumbered so that they start at 0 again.
If you have the print-u utilities successfully loaded, then you can print graph windows just as you would print any other window -- by selecting "Print" under the file menu. Print-u utilities can be obtained from the MCL contributions ftp sites, or just grab the compiled file from here.
Here are some tricks to ease examination of the contents of a graph. First select the graph and then hit the space-bar. The first line of the graph is highlighted. The left-right arrow keys move the highlighting from one line to the other in sequence, so each can be easily picked out from the others. Hitting the space-bar again turns off highlighting. Move the cursor over the data space of a selected graph and it turns into a cross-hair. If you now click, the precise coordinates of the clicked point are printed to the listener window.
The function (grid-graph)
lays a grid of dotted lines out from each tick
mark, horizontally and vertically. A first optional argument specifies
the density of the dots (by default it is 5, meaning every
fifth pixel is dark).
A second optional argument specifies the graph in the usual way
with a graph-title-string.
You can access the default graph window in the same way as the
graphing routines do internally by calling (choose-graph
graph-title-string).
The default color of the nth line on a grapth is determined
by the internal function (nth-color
graph n). The current implementation returns the colors red,
green, blue, black, yellow, pink,
cyan, purple, magenta, orange, brown, light-blue, gray, dark-green, and
tan,
in that order starting from 0. You can change this simply by redefining
nth-color. See the color specification routines in G for how to
specify and construct colors.
Of course if you have compiled these files you will want to leave off the "(load "ccl:library;quickdraw.lisp")
(load "g.lisp")
(load "graph.lisp")
(use-package :graph)
.lisp